Appendix 1 – Workforce Ethnicity Profile
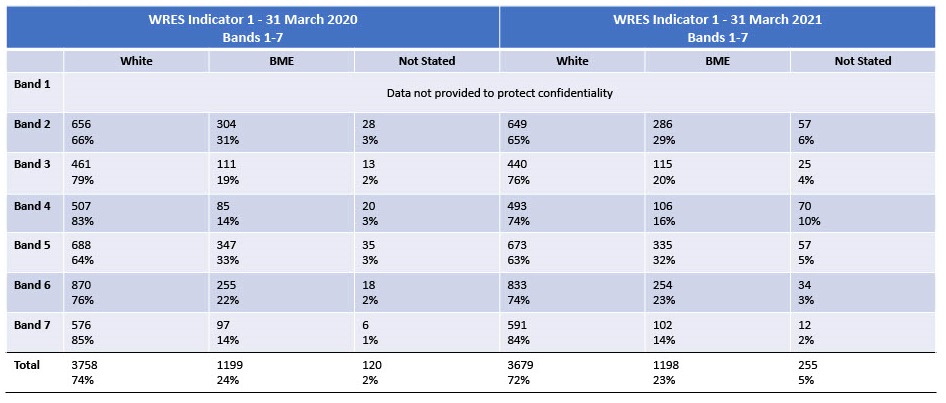
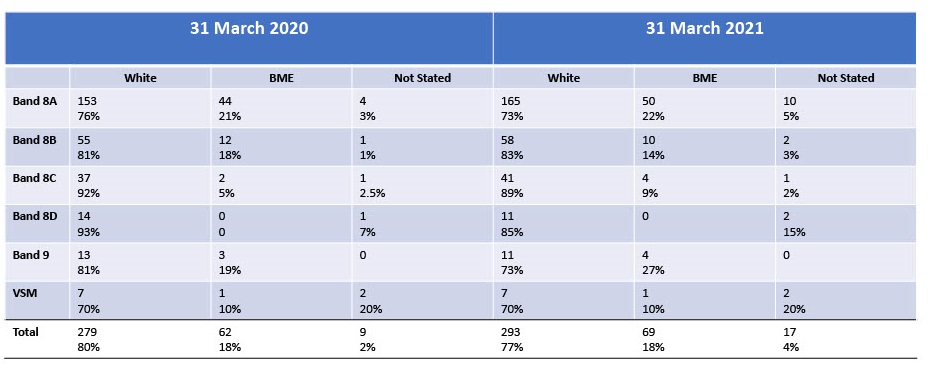
Workforce Race Equality Standard (WRES) Indicator 1 – Workforce Ethnicity Profile by Pay Band
WRES Progress
- Workforce representation. Percentage of white and BME staff in each of the AfC Bands 1-9 and VSM (including executive Board members) compared with the percentage of staff in the overall workforce
What does this tell us?
The above tables highlight the differing ethnicity profile of our workforce across the various pay bands. There is a 5% difference between the number of colleagues from a Black. Asian, Mixed or Other ethnic minority background in Bands 1-7 compared to senior leadership bands 8A and above. This suggests that more work is required to support progression pathways for colleagues from a BME background into senior leadership roles.
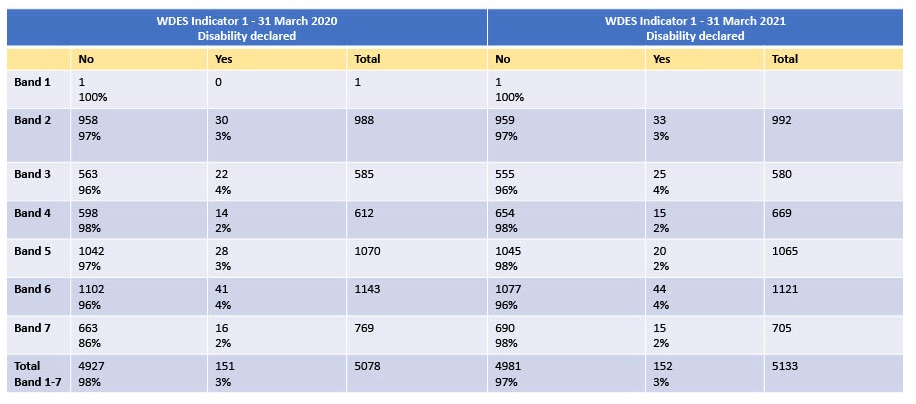
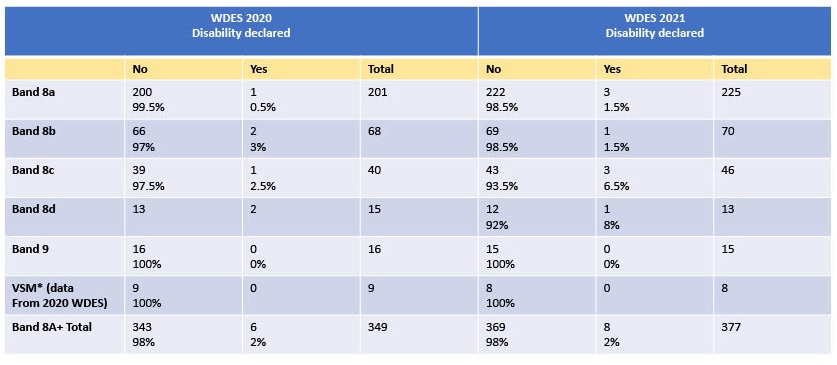
Workforce Disability Equality Standard (WDES) Indicator 1 – Workforce Disability Profile by Pay Band
WDES Progress
- Workforce representation. Percentage of disabled and non-disabled staff in each of the AfC Bands 1-9 and VSM (including executive Board members) compared with the percentage of staff in the overall workforce
What does this tell us?
The above tables highlight that the number of staff declaring a disability has stayed approximately the same over the last two years. Buckinghamshire Census data 2021 will support us to better understand the profile of our staff in relation to the population of the county.